Chart patterns and market stages are pieces of the same puzzle. Trying to use one without the other will only lead to an incomplete picture.
The patterns identified by Autochartist and the results incorporate trend and direction. It is for this reason that any trader who uses charts and chart patterns should learn how to identify market stages to be able to capitalize on trends and shifts in trends more effectively. This does not exclude the fact that all traders would benefit from this analysis.
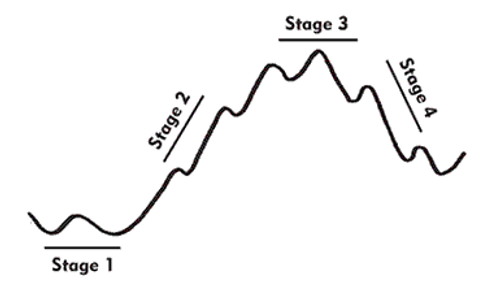
There are
four stages in any market. This applies equally to Forex, Stocks, and Futures. Any market that you can chart can be analyzed with cycles. The reason for this is natural moves in cycles. The market is just one reflection of human nature: fear and greed.
Each stage reflects psychological reactions to the market, overall opinion of price and news. Chartists believe that the fundamentals of the market are reflected in the price. Therefore understanding whether the “crowd” is fearful, greedy or simply without an opinion is a key factor to setting up any trade. All studies, patterns, strategies, in fact every aspect of trading is most effective when applied to the correct cycle.
There are only two types of markets: trending and sideways. The
four stages are
mark up,
mark down,
accumulationand
distribution. These are the generally accepted names for the four stages and apply to everything from the stock market to the real estate market.
Each stage represents market momentum or lack thereof. The
mark up and mark down stages are more commonly known as uptrends and downtrends.
Accumulation and distribution are the two sideways stages. There are distinct differences between the two stages. Accumulation (stage 1) develops as a narrow price range with a solid support and resistance level. Accumulation typically occurs with low volume and precedes a move higher although a move lower can also occur.
Distribution (stage 3) is a more volatile stage with less defined support and resistance levels. It typically occurs at the end of a move higher or “mark up” (again this is not always the case as distribution can develop after a move lower) and can develop Triangle, Pennant, Double Tops/Bottoms, Triple Tops/Bottoms chart patterns.
There are certain patterns that develop within specific stages. Understanding which stage is most suited for Wedges, Triangles, Channels, and Rectangles, as well as understanding all the patterns Autochartist identifies is key to effective chart pattern analysis and trading.
Market stages can also assist with measuring and trading trending patterns and reversals. These types of entries are considered “corrective” or “contrarian” entries as they capitalize on pullbacks or bounces to trigger trade.